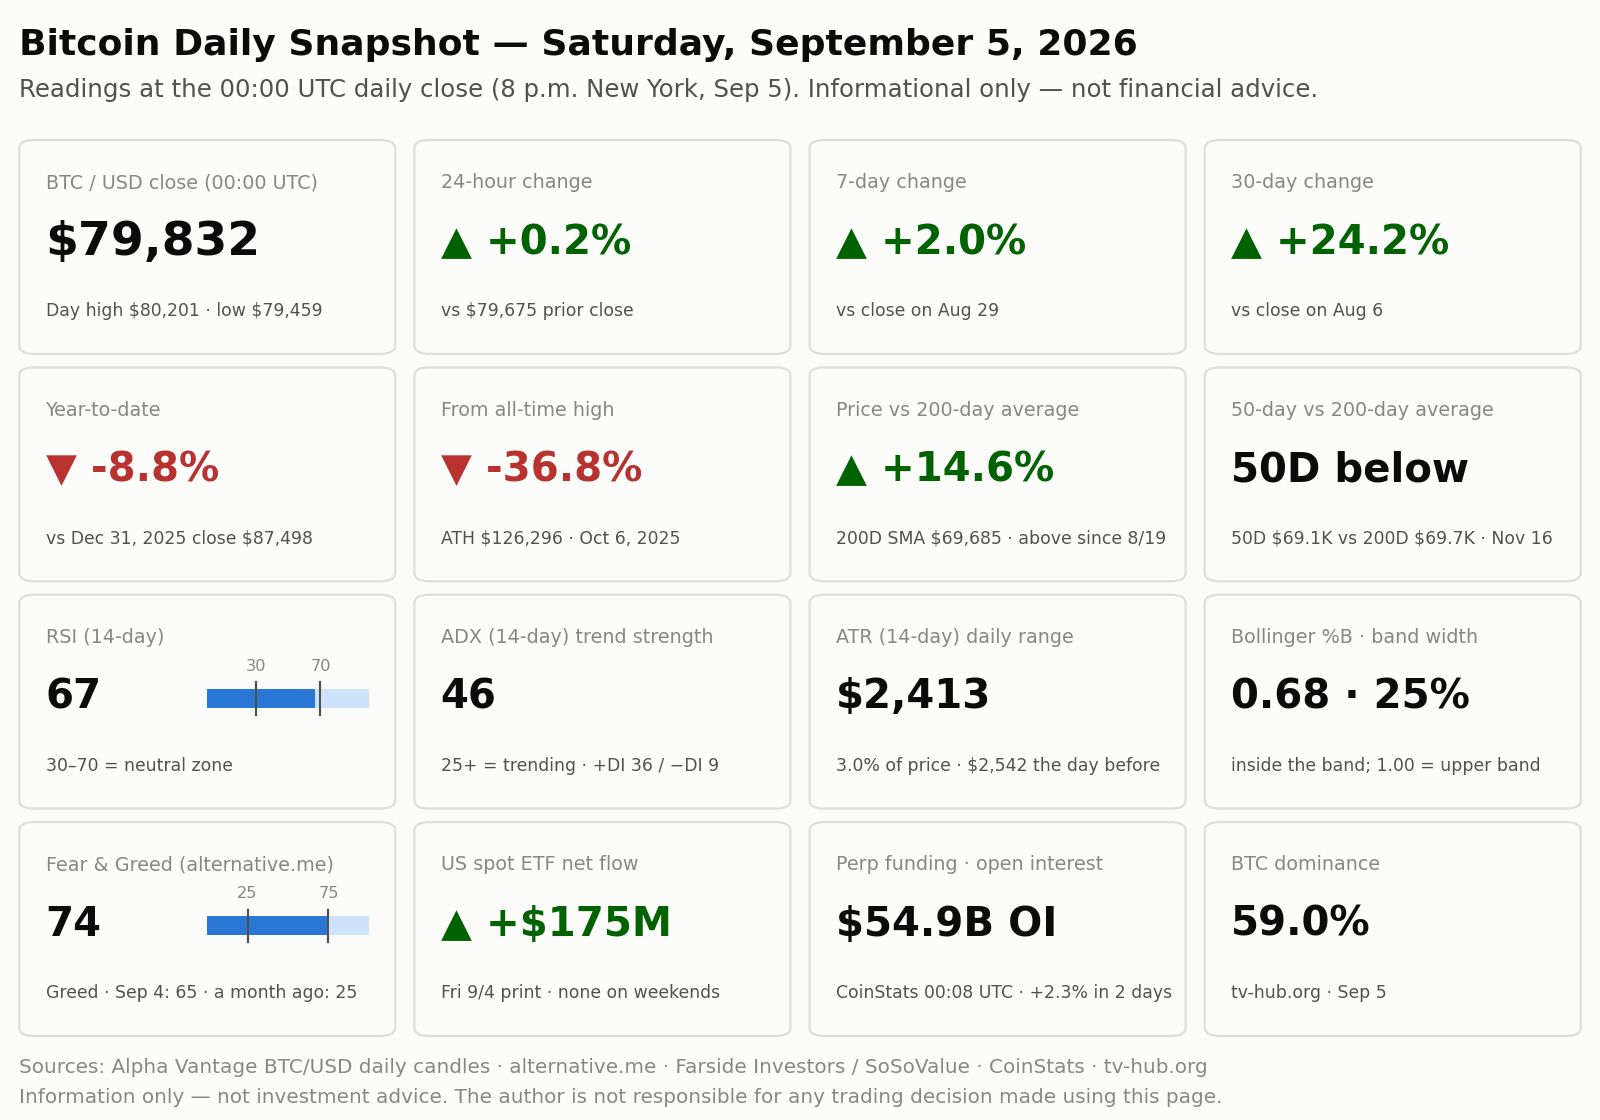
Bitcoin price on September 5, 2026: BTC closed at $79,832, up 0.20%, in a $742 range between an $80,201 high and a $79,459 low — the narrowest day since August 16, on a quarter of normal volume, while the gap between the 50-day and 200-day averages closed to $593. The snapshot and charts are first, the short version follows, and the full explanations are at the end for anyone who wants them.
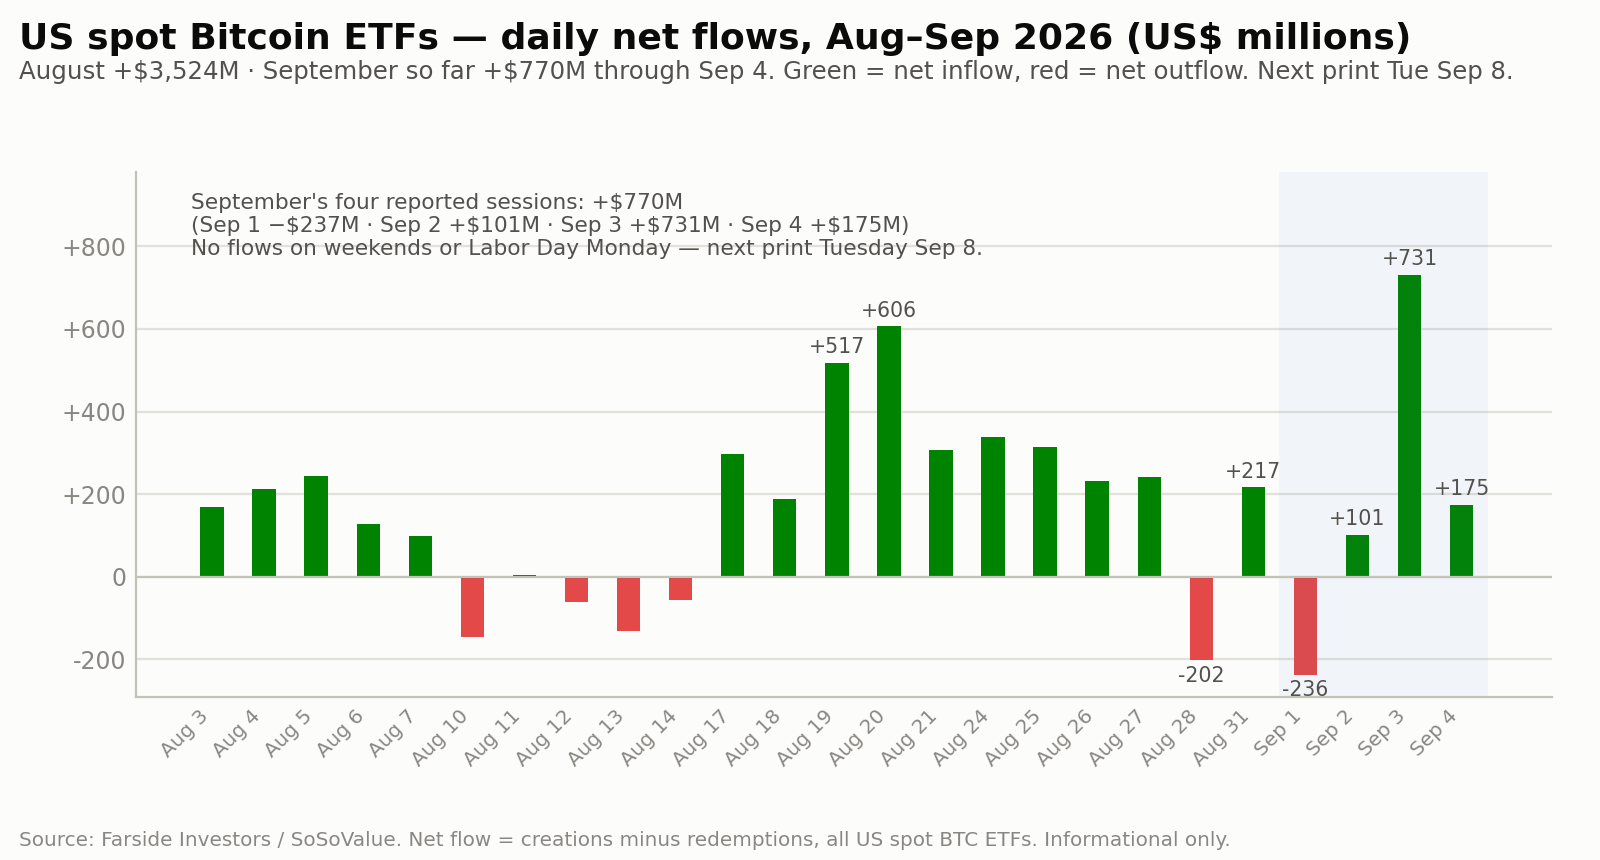
Informational only. This brief reports market data and publicly available news. It is not investment, trading, or financial advice, and it does not recommend buying, selling, or holding anything. The author is not responsible for any decision made using this information. Numbers are as of the 00:00 UTC daily close on September 5, 2026 (8 p.m. New York time) unless a different time is stated. One update to yesterday’s edition. Friday’s US spot Bitcoin ETF flow, reported here as not yet available, has settled at a net inflow of $174.6 million, so September’s four reported sessions now total about +$770 million.
New to the indicators? Every name below links to the plain-English explanations in Bitcoin Indicators Explained. Yesterday’s edition: September 4, 2026. About this series: Bitcoin Daily Brief.
Bitcoin price on September 5, 2026, at a glance
The charts
The 30-second read
Bitcoin spent Saturday almost perfectly still, closing at $79,832, up 0.20%, inside a $742 range that was its narrowest since August 16 and just 0.29 times Friday’s average daily range, on volume of 2,148 BTC — a quarter of the twenty-day average and the lightest session in three weeks. Underneath that stillness the structural clock kept running: the gap between the 50-day and 200-day averages closed a forty-seventh consecutive day, to $593 from $850, putting a golden cross roughly three sessions away; Bollinger band width contracted a seventh straight day to 24.53%; and ADX rose an eighteenth session to 46.25, its highest since March 3 — while the MACD histogram widened to −108.96 and Friday’s ETF print settled at a modest +$174.6 million. US markets are shut on Monday for Labor Day, so after Sunday evening’s weekly close the next scheduled tests are August producer prices on September 10, August consumer prices on September 11, and the FOMC on September 15–16.
What happened in the last 24 hours
- Price. Opened $79,675, reached $80,201, fell to $79,459 and closed $79,832 (+0.20%, +$156) — a $742 range, the narrowest since August 16, on volume of 2,148 BTC, 0.25 times the twenty-day average.
- Flows. Friday’s US spot ETF flow settled at +$174.6 million, with BlackRock’s IBIT at +$117.4 million and Fidelity’s FBTC at +$57.2 million and every other fund flat, taking September’s four reported sessions to +$770 million; there are no weekend flows, and Labor Day Monday makes Tuesday September 8 the next print.
- Positioning. CoinStats’ 00:08 UTC snapshot put open interest near $54.9 billion and the funding rate at −0.0007% per eight hours (about −0.77% annualized) against a seven-day average of +0.0051%, with 24-hour liquidations of just $75.3 million, 89.6% of them long positions; Blockchain.News’ automated summary gave funding as +0.0010% instead, so the sources straddle zero.
- On-chain. The difficulty retarget landed, lifting difficulty about 1.30% to 127.45T at block 965,664 — close to CoinWarz’s +1.35% estimate — with the next adjustment now estimated at +1.2% on September 19; Decrypt reported four more decade-old wallets moving a combined $15.7 million between August 29 and September 4, one batch to Coinbase.
- Macro and policy. US stock and bond markets were closed for the weekend, leaving Friday’s levels standing (S&P 500 7,718.60, Nasdaq Composite 26,506.99, Dow 53,414.26, 10-year Treasury yield 4.78%, dollar index 99.17) with CME FedWatch hike odds near 60% for September 15–16; total crypto market value was about $2.70 trillion and Bitcoin dominance 59.0%.
Section summaries
Price and trend
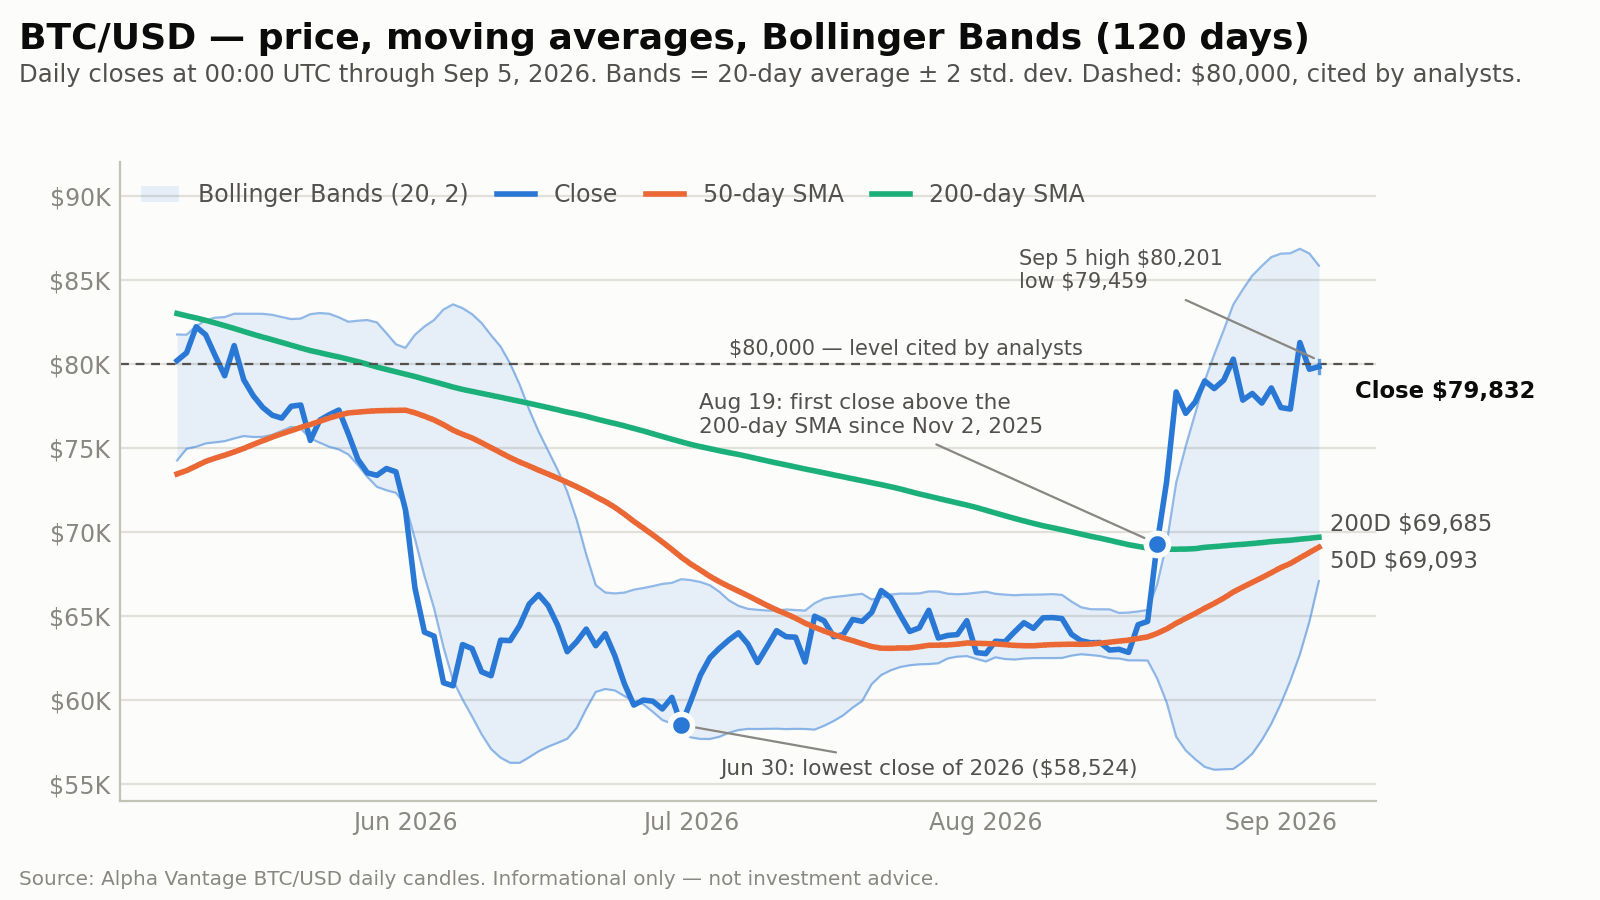
Bitcoin closed 14.6% above the 200-day average ($69,685) for an eighteenth straight session, and the day’s $742 range was the eleventh narrowest of 2026’s 248 sessions. The structural story is the convergence: the 50-day/200-day gap closed a forty-seventh consecutive day, by $257 to $593, and three separate arithmetics now put a golden cross two to three sessions out, with a mechanical roll-forward landing on Tuesday, September 8. Levels being cited: Glassnode’s $81,000–$86,000 supply zone and $80,800 short-term-holder cost basis above; $78,000 options max pain for the September 18 expiry (DWF Labs) and $77,000 (New Market Trading) below. Details ↓
Momentum and volatility
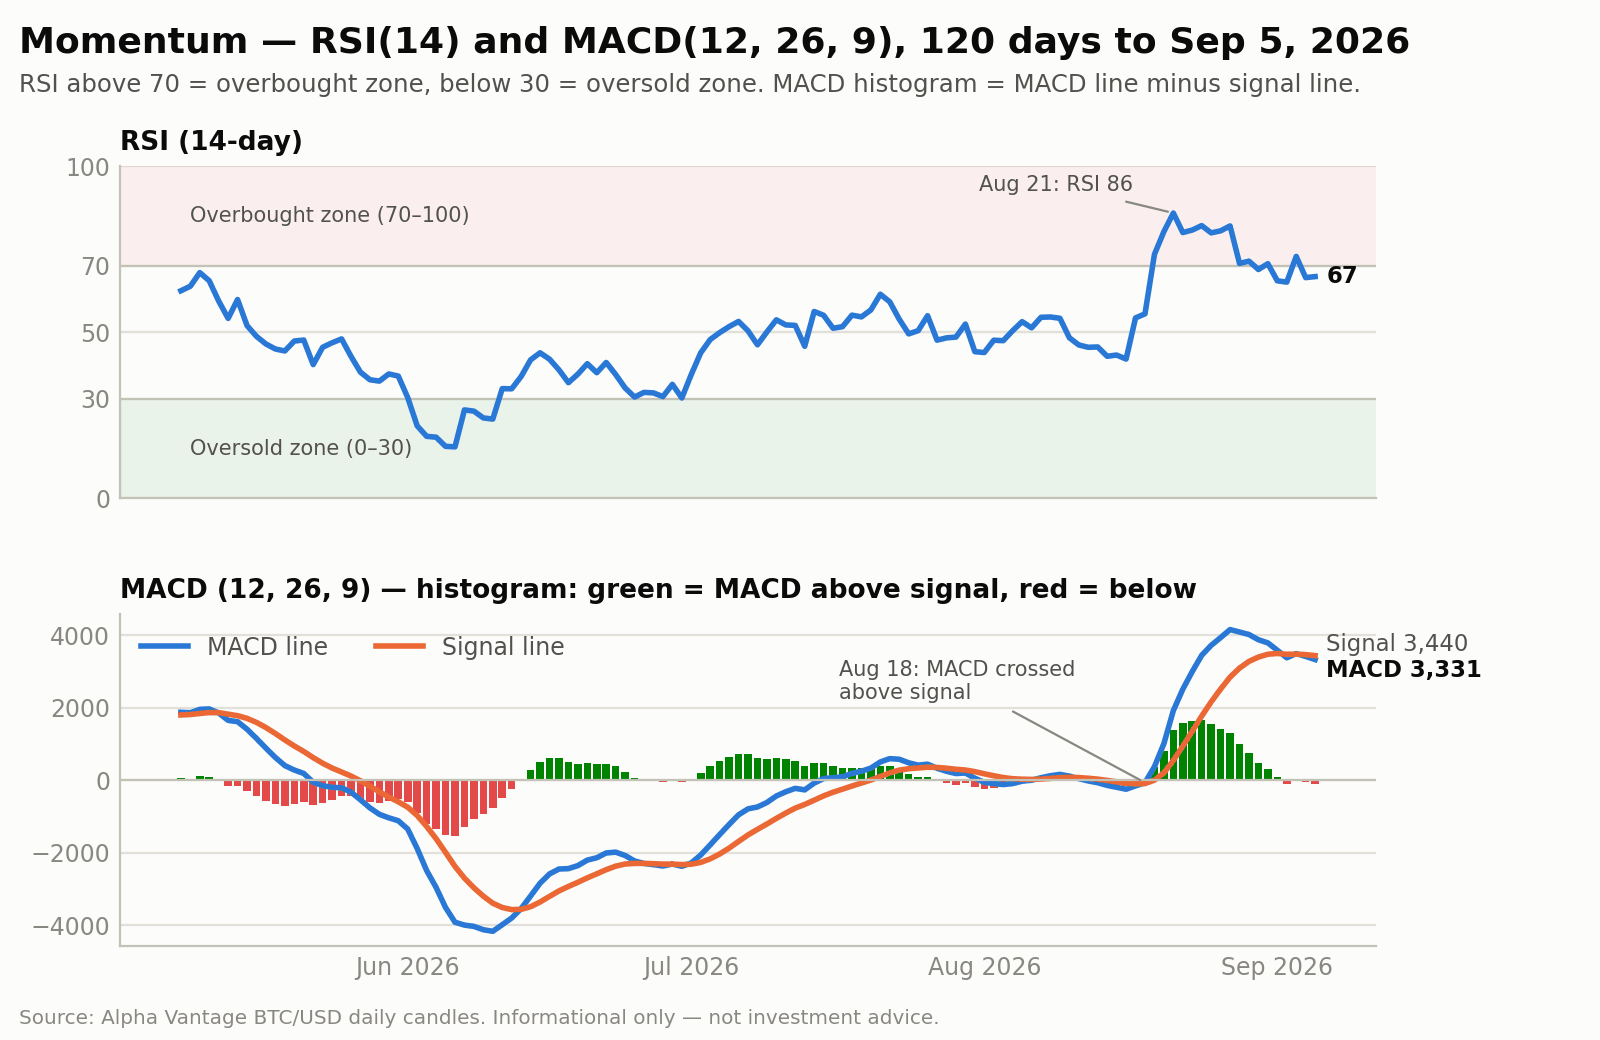
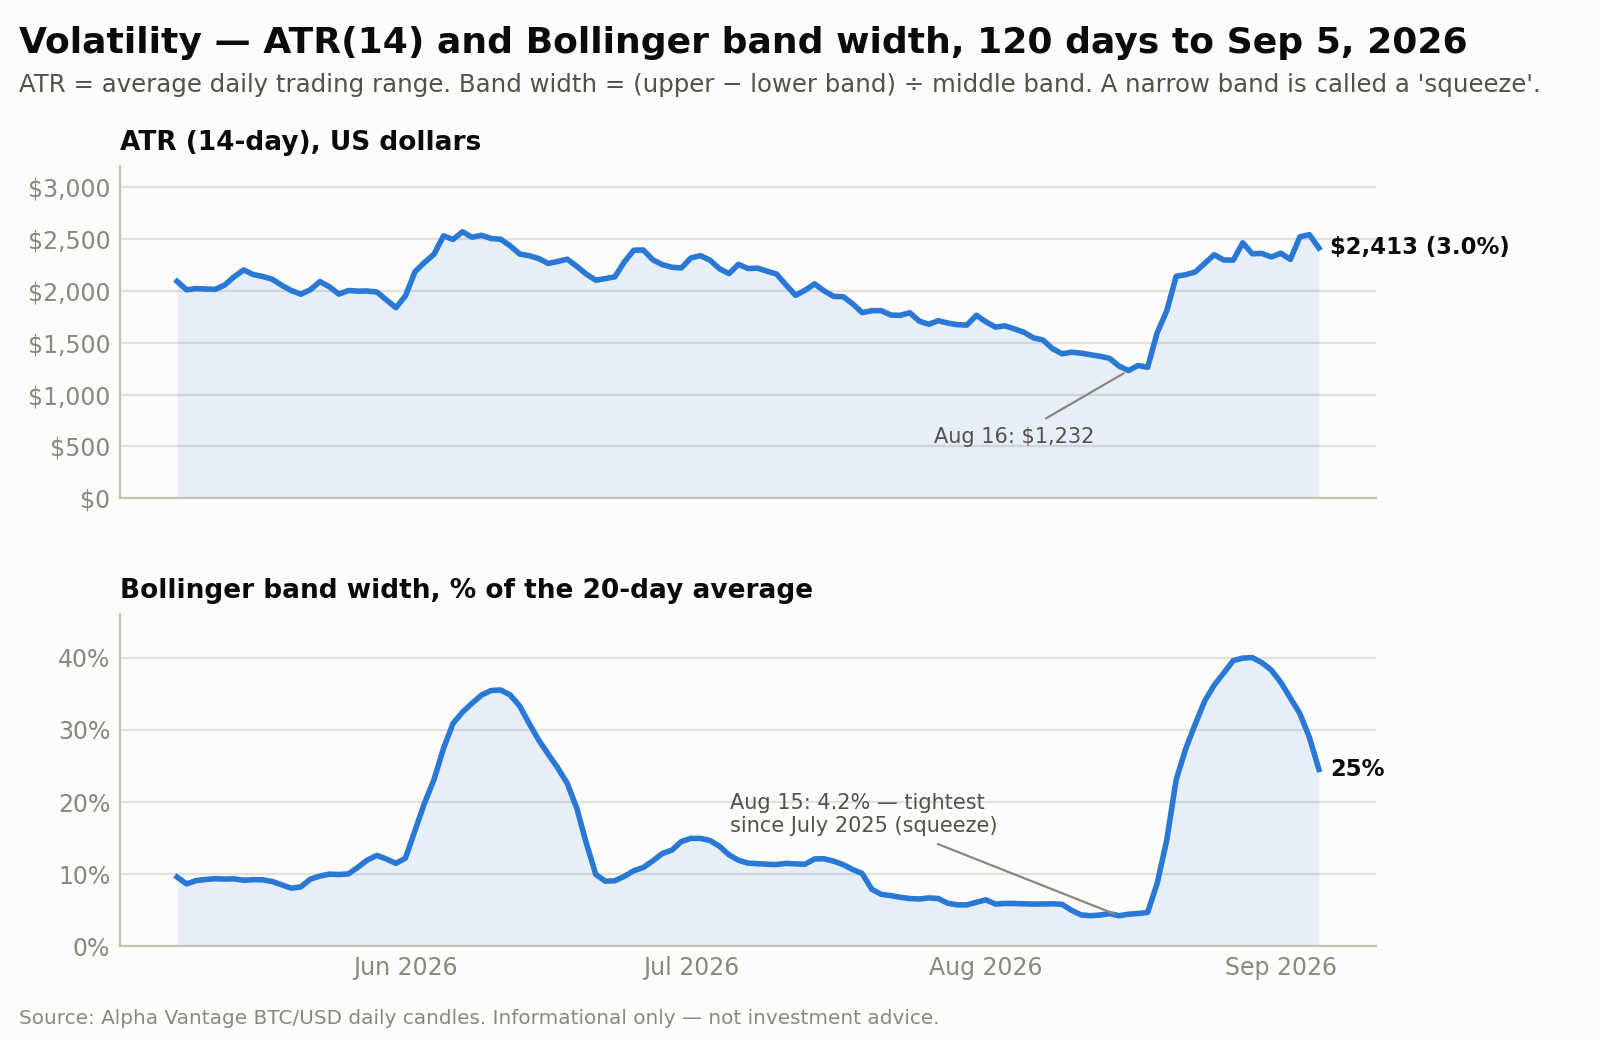
The MACD histogram widened to −108.96 from −49.50 as the MACD line fell $87 to 3,330.79 against a signal line that eased only $27 to 3,439.74 — a second day below signal after Thursday’s one-day bullish crossover, and still 3,331 above zero. RSI was effectively unchanged at 66.80 against 66.49, and ADX rose an eighteenth consecutive session to 46.25, its highest since March 3, 2026, even as the spread between the directional lines narrowed for a second day, from 27.3 to 26.7 points. Volatility compressed on every measure: ATR fell to $2,413 from $2,542, 30-day realized volatility eased to 46.42%, and band width contracted a seventh straight day to 24.53% — from both sides again, with the upper band down $722 and the lower band up $2,421. Details ↓
Flows and positioning
Friday’s ETF print, unknown at this hour yesterday, settled at +$174.6 million — a quarter of Thursday’s $730.8 million, and this time the first look and the settled figure agreed, ending four consecutive prints that had moved materially between the two. That takes September’s four reported sessions to +$770 million, and the latest week to +$986.9 million inside a three-week run of $3.8 billion that Cointelegraph calls the strongest stretch of 2026. Derivatives went quiet with price: CoinStats’ snapshot showed 24-hour liquidations of $75.3 million against Friday’s $757 million, and funding at or just below zero for the first time in months on that reading. Details ↓
On-chain and network
The difficulty retarget that this brief has been tracking for three days landed on Saturday: difficulty rose about 1.30% to 127.45T at block 965,664, close to CoinWarz’s +1.35% estimate and the opposite sign to the −1.31% of August 23. A positive retarget is the network’s own answer to the hashrate-decline story of the past week, since difficulty rises only when blocks have been arriving faster than the ten-minute target. The next adjustment is estimated at +1.2% to 128.98T on September 19. Details ↓
Sentiment
alternative.me printed 74 (“Greed”) for September 5, up nine points from 65 on September 4 — the index has now risen on each of the last two days, one of which price fell 2% and one of which it barely moved. The weekend news feed was thin: eight Bitcoin-tagged articles, scored one bullish, four somewhat bullish, three neutral and none bearish. Published views stayed split, with Bitfinex flagging a bullish weekly Super Trend signal and Wincent’s Paul Howard describing a gradual path toward $100,000 by end-2026, against Fidelity’s caution that broader cycle corrections may need more time and Peter Schiff’s argument that Bitcoin may be forming a top. Details ↓
Macro and cross-asset
There was no macro on Saturday: US stock and bond markets were closed for the weekend and will be closed again on Monday for Labor Day, so Friday’s levels are the standing ones — the S&P 500 at 7,718.60, the Nasdaq Composite at 26,506.99, the Dow at 53,414.26, the 10-year Treasury yield at 4.78% and the dollar index at 99.17. CME FedWatch odds of a rate increase at the September 15–16 FOMC remain near 60% after Friday’s 162,000-job payrolls print, against a target range of 3.50%–3.75%. Total crypto market value was about $2.70 trillion with Bitcoin dominance at 59.0%, and privacy coins led the weekend tape, with Zcash up 16–20%. Details ↓
Calendar
Sunday September 6, 8 p.m. ET: the weekly candle closes, and the 50-week average computed here at $80,333 sits $502 above Saturday’s close. Monday September 7: Labor Day, US markets closed. Tuesday September 8: ETF flow reporting resumes and the golden cross falls due on a mechanical projection. Thursday September 10: August producer prices and the ECB decision. Friday September 11: August consumer prices. September 15–16: the CLARITY Act cloture vote and the FOMC. Details ↓
Reading the combination
Saturday is the quietest day of the rally, and the interesting thing about it is that nothing stopped moving except price: trend improved, volatility compressed for a seventh day, momentum leaked further, and the calendar emptied. Compression is the only reading on which every layer agrees, and the base rate attached to it is a coin flip — 420 prior cases of a seven-day band-width contraction from above 30% were higher twenty sessions later 49% of the time. The bracketing levels are $80,201 to $80,333 immediately above, covering Saturday’s high and the 50-week average, and $79,459 down to $78,000 below. Details ↓
Learn the indicators: every reading above is explained, with charts and the combinations traders watch, in Bitcoin Indicators Explained.
The details, for readers who want more
Signal board
| Indicator | Reading (Sep 5 close) | Zone | Change since Sep 4 | What this zone has historically meant |
|---|---|---|---|---|
| Price vs 200-day SMA | $79,832 vs $69,685 (+14.6%) | Above (18th straight close, since Aug 19) | +14.4% → +14.6% | Price above the 200-day average is the most common definition of a long-term uptrend. This series contains 54 completed runs above the 200-day average since the 200-day first has a value here in February 2011, of which 18 reached at least 18 sessions; those 18 ran a median 161.5 sessions in total, and only three of them ended between days 18 and 24. Runs that get this far have usually continued — on a sample of 18. |
| 50-day vs 200-day SMA | $69,093 vs $69,685 | 50-day below (death cross since Nov 16, 2025) | Gap $850 → $593 | A 47th consecutive day of narrowing, and at $257 the 11th-largest day of the run, against a $339 maximum on August 21 and a run average of $195 a day. The gap is the narrowest since November 17, 2025. Saturday’s pace implies a golden cross in about 2.3 sessions, the run’s average pace about 3.0, and holding price flat at $79,832 while rolling both windows forward mechanically puts it at three, or Tuesday September 8. All three assume things that will not hold exactly: the 50-day will move with whatever price does next, and a sharp fall would push the crossing out or cancel it. The death cross is 293 days old. This series contains twelve golden crosses since 2012, after which price was higher thirty days later six times out of twelve (median −2.6%) and sixty days later eight times out of twelve (median +12.6%). |
| Price vs 20-day SMA | +4.4% above ($76,459) | Above, close to the average | +5.4% → +4.4% | The distance narrowed by 1.0 point, and this time the mechanism was entirely one-sided: price rose $156 while the 20-day average itself rose $850, so the compression came from the average catching up rather than from the price falling — the opposite of Friday, when two-thirds came from the fall. That is what an average does after a large move drops out of its window. |
| RSI (14) | 66.80 | Upper neutral zone (30–70) | 66.49 → 66.80 | A third of a point higher, and a second session below 70. A flat RSI on a flat day is exactly what the formula produces: the measure compares the size of average up-days with average down-days over fourteen sessions, and Saturday added a $156 up-day to both sides of that ratio, which barely moves it. |
| MACD (12, 26, 9) | 3,331 vs signal 3,440; histogram −108.96 | Below signal, far above zero | Histogram −49.50 → −108.96 (widening) | A second day below the signal line, and the gap roughly doubled. The MACD line fell $87 while the signal line eased only $27, which is the ordinary arithmetic of a fast average decaying toward a slow one after a peak. The line is still 3,331 above zero, so this describes a loss of upward momentum rather than a change of trend direction. Of 631 earlier days in this series with a negative and widening histogram, the MACD line above zero and price above its 200-day average, the close was higher ten sessions later 55% of the time (median +0.8%) and twenty sessions later 53% (median +0.8%) — close to a coin flip with a slight upward tilt. |
| Bollinger Bands (20, 2) | %B 0.68; band width 24.53% | Inside the band, upper half | %B 0.69 → 0.68; width 29.0% → 24.5% | A seventh straight contraction from the 40.03% peak of August 29, the narrowest since August 21, and the largest single-day contraction of the run at 4.4 points. It narrowed from both sides again: the upper band fell $722 to $85,838 while the lower band rose $2,421 to $67,080, as the twenty-day standard deviation shrank faster than the mean rose. Price finished 0.68 of the way up a band running $67,080 to $85,838. Of 420 earlier cases in this series of band width contracting seven days in a row from a level of 30% or more, price was higher twenty sessions later 49% of the time, median −0.5%, and ten sessions later 49% (median −0.4%) — a coin flip. A squeeze describes dispersion compressing; it says nothing about which way the next move goes. |
| ADX (14) | 46.25 (+DI 36.0, −DI 9.4) | Strongly trending (above 25) | 45.28 → 46.25 | An 18th consecutive rise and the highest reading since March 3, 2026 — but for a second day the internals moved the other way, with the spread between the directional lines narrowing from 27.3 to 26.7 points as +DI fell from 36.9 to 36.0. ADX is a fourteen-period smoothing of that spread, so it can keep climbing for several sessions after the spread has peaked; an 18th consecutive rise is a statement about the past fortnight rather than about Saturday. Days in this series with ADX at or above 46 and +DI above −DI (594 instances) were followed by a higher close ten sessions later 66% of the time (median +4.4%) and twenty sessions later 67% (median +6.6%); those instances cluster in a handful of strongly trending years. |
| ATR (14) | $2,413 (3.0% of price) | Falling from a three-month high | $2,542 → $2,413 | The first fall in three sessions, and a large one, because Saturday’s $742 high-to-low range was only 0.29 times Friday’s ATR — the narrowest day since August 16 and the eleventh narrowest of 2026’s 248 sessions by dollar range. One quiet day pulls a fourteen-day average down by $129; it takes a run of them to change what the average describes. |
| 30-day realized volatility | 46.4% annualized | Elevated, just off a five-month high | 46.6% → 46.4% | Essentially unchanged, and a shade below Friday’s reading, which was the highest since April 2. The measure is a thirty-day window that still contains the August expansion and Thursday’s 5.1% move; a single quiet day cannot move it far, and whether it falls from here depends on the size of the days replacing the August ones as they roll out. |
| Volume vs 20-day average | 2,148 BTC vs 8,563 average (0.25×) | Far below average | 6,701 → 2,148 BTC | The lightest session since August 16 by raw volume and the lowest ratio to its own twenty-day average since August 15 — roughly the 2nd percentile of 2026. This is a Saturday in the middle of a three-day US weekend, so the reading says more about who was absent than about who was selling. Of 48 earlier days in this series with volume below 0.30 times its twenty-day average and price above the 200-day average, the close was higher ten sessions later 62% of the time (median +1.7%) and twenty sessions later 65% (median +5.6%) — on a sample of 48, which is small. |
| US spot ETF net flows | Fri Sep 4: +$174.6M; September ≈ +$770M; August +$3,524M; no weekend flows | Inflows continuing, at a quarter of Thursday’s size | Sep 4 unknown → settled at +$174.6M | BlackRock’s IBIT took +$117.4M of the total, about 67%, and Fidelity’s FBTC +$57.2M; every other US spot Bitcoin ETF showed no net flow at all on Farside’s per-fund table, which is unusual and is itself a sign of a thin pre-holiday session. The settled figure matched the first look this time, breaking a run of four consecutive prints that had moved materially between the two. Cointelegraph puts the latest week at +$986.9M and the three-week run at $3.8 billion, the strongest stretch of 2026, while Ether ETF inflows fell about 74% week-over-week to $218.4M and XRP ETF inflows about 83% to $19M. |
| Perpetual funding rate | −0.0007% per 8h (≈ −0.77% annualized) on one source; +0.0010% on another | At or just below zero | No day-over-day change claimed | The two sources available straddle zero, and both are close enough to it that the distinction matters less than the level. CoinStats’ 00:08 UTC snapshot gives −0.0007% per eight hours, which annualizes to about −0.77% on the ×3×365 convention used throughout this brief, against a seven-day average of +0.0051%; Blockchain.News’ automated summary gives +0.0010% per eight hours and calls it neutral. Either way this is the first time in months this brief has seen a reading at or below zero, which would mean shorts paying longs rather than the reverse. It is worth treating as a weekend reading on thin volume rather than as a change in positioning. |
| Open interest / liquidations | OI ≈ $54.9B on CoinStats; 24-hour liquidations ≈ $75.3M | Liquidations collapsed; OI reading inconsistent | No day-over-day change claimed | Liquidations fell about 90%, from roughly $757 million on Friday to $75.31 million, of which $67.45 million (89.6%) were long positions — a small absolute number on a quiet day, but still long-heavy. The open-interest figure cannot be used for a day-over-day comparison: the same tracker reported about $57.68 billion yesterday and about $54.90 billion today while simultaneously describing open interest as up 2.30% over two days, which cannot all be true at once, and Blockchain.News separately reports open interest up 6.58% in 24 hours. No single-day change is claimed here. |
| Fear & Greed | alternative.me 74 (Greed) | Greed | 65 → 74 | A nine-point jump, the largest single-day move in the index since this brief began tracking it, on a day price moved 0.2%. The explanation is the same convention noted in earlier editions: the value dated a given day is struck at the start of that UTC day, so the September 5 reading captures Friday’s US session — the payrolls sell-off and the recovery from $78,626 into the close — rather than Saturday’s quiet. The index also blends volatility, momentum, dominance and survey inputs rather than tracking price, and a collapse in volatility raises it mechanically. At the time of writing the page showed 73 for the next day, 68 a week ago and 25 (“Extreme Fear”) a month ago. |
| Hashrate / difficulty | Difficulty 127.45T; block height 965,676 | Retarget completed | 125.81T → 127.45T (+1.30%) | The adjustment this brief flagged as pending for three days landed at block 965,664 on Saturday, raising difficulty about 1.30% to 127,450,789,715,843 — close to CoinWarz’s +1.35% estimate and the reverse of the −1.31% adjustment of August 23. Difficulty rises only when the preceding 2,016 blocks arrived faster than the ten-minute target, so a positive retarget is direct evidence that mining capacity was stable or growing through late August, and it settles the question raised by the divergent hashrate estimates of the past week. CoinWarz now estimates the next adjustment at +1.2% to 128.98T on September 19 at about 4:23 p.m. UTC, with average block time running at 9 minutes 53 seconds. |
Price and trend (chart 1)
Saturday was the quietest session of the rally by every measure of activity. Bitcoin opened at $79,675 — Friday’s close, as the daily candles here are continuous — traded up to $80,201, down to $79,459, and closed at $79,832, a gain of $156.45 or 0.196%. The range was $741.93, or 0.93% of the closing price and just 0.29 times Friday’s ATR: the narrowest day since August 16 in dollar terms, the eleventh narrowest of the 248 sessions of 2026 so far by dollar range and the sixth narrowest measured against the closing price. The candle’s body was the whole $156, only 21.1% of the range, with a $369 upper wick and a $216 lower wick (a wick is the thin line above or below the candle body, marking where price traded but did not close), and the close finished 50.3% of the way up the range — as close to the middle as a day gets. Volume was 2,148 BTC against a twenty-day average of 8,563, a ratio of 0.25 and the lowest since August 15. That is a Saturday inside a three-day US weekend, so it describes absence rather than intent. Against longer reference points the close sits 36.8% below the all-time high of $126,296, 8.8% below the 2025 year-end close of $87,498, and 36.4% above the June 30 low close of $58,524. September is 1.6% higher over its first five sessions, in a month that has finished negative in nine of the sixteen completed Septembers in this record and is the weakest calendar month in the series by average return, at −3.3% — though the last three Septembers all closed positive, at +4.0%, +7.3% and +5.4%.
What did move was the trend structure, and it moved further on a flat day than it did on Friday’s 2% fall. Bitcoin closed 14.6% above the 200-day average ($69,685), 15.5% above the 50-day ($69,093), 20.2% above the 100-day ($66,400) and 4.4% above the 20-day ($76,459) — an eighteenth consecutive close above the 200-day, in the run that began on August 19. The 50-day/200-day gap closed to $592.59 from $849.51, a narrowing of $256.93 and a forty-seventh consecutive day of it; at $257 that was the eleventh-largest single day of the run, against a $339 maximum on August 21 and a run average of $195 a day. The gap is the narrowest since November 17, 2025, the day after the death cross formed. Three arithmetics now bracket the crossing more tightly than they did yesterday: Saturday’s pace implies about 2.3 sessions, the run’s average pace about 3.0, and a mechanical projection that holds price flat at $79,832 and rolls both averages forward — replacing mid-July closes near $65,000 in the 50-day window — puts it at three, or Tuesday September 8. Because Bitcoin trades every day, the Labor Day holiday does not delay it. All three are projections of two moving averages rather than forecasts of price, and the 50-day will move with whatever price does next. For what the event has been worth historically, this series contains twelve golden crosses since 2012, after which price was higher thirty days later six times out of twelve (median −2.6%) and sixty days later eight times out of twelve (median +12.6%) — a split that argues against reading the crossing itself as the story. One level worth naming before Sunday: the 50-week moving average computed here stands at $80,333, and Saturday’s close is $502 below it, so the weekly candle that closes at 8 p.m. New York on Sunday will settle just under it unless price moves first.
Levels being discussed (attributed)
| Level | Why it is being watched | Who cites it |
|---|---|---|
| $100,000 | Named as a “gradual trajectory” destination by end-2026, on ETF inflows and retail liquidity | Paul Howard, Senior Director, Wincent, via Crypto Economy (Sep 3–4) |
| $85,838 | Upper Bollinger Band, 7.5% above the close | This brief’s calculation |
| $85,801 | The same upper band as computed by a different feed — a $37 difference worth noting rather than resolving | Blockchain.News automated technical summary (Sep 5) |
| $85,000 | Named as the level the market could reach if $80,600 held, on an hourly-chart channel break | Ali Charts, independent technical analyst, via CoinGape (Sep 4) |
| $82,283 | Thursday’s high, the highest since May 11 and the high of September so far | Alpha Vantage feed |
| $82,072 | The 365-day moving average, which CryptoQuant has described as its bull-market confirmation test “near $83,000”; computed here at $82,072 | CryptoQuant via Cointelegraph; this brief’s calculation |
| $82,000–$87,000 | Upside range named on a clean break of $80,000 | Ryan Lee, Chief Analyst, Bitget Research, via Crypto Times (Sep 4) |
| $81,000–$86,000 | Overhead supply zone — the price band where earlier buyers are near break-even | Glassnode, via Crypto Times (Sep 4) |
| $80,800 | Short-term-holder cost basis | Glassnode, via Crypto Times (Sep 4) |
| $80,333 | 50-week moving average, computed here; Sunday’s weekly close is measured against it | This brief’s calculation |
| $80,201 | Saturday’s high | Alpha Vantage feed |
| $80,000 | Round number, unrecovered on a closing basis since September 3; near-term call option demand is concentrated at this strike; the dashed line on chart 1 | Bitcoin News Digest options summary (Sep 5); widely cited |
| $79,459 | Saturday’s low | Alpha Vantage feed |
| $78,000 | Options max pain for the September 18 expiry — the strike at which the largest number of contracts expire worthless | Martin Lee, Market Insights Lead, DWF Labs, via Crypto Times (Sep 4) |
| $77,000 | The immediate level named below the market, with $72,000 named beyond it | Frank Hepworth, New Market Trading, via Yahoo Finance (Sep 2) |
| $76,459 / $69,685 | 20-day and 200-day simple moving averages | This brief’s calculation |
| $76,350 | True Market Mean — an estimate of the average cost basis of active investors | Bitfinex Alpha, via Crypto Times (Sep 4) |
| $72,563 | 200-day exponential moving average | This brief’s calculation |
| $69,093 | 50-day simple moving average — the line converging on the 200-day | This brief’s calculation |
| $67,080 | Lower Bollinger Band | This brief’s calculation |
Two notes on the table. The upper Bollinger Band appears twice, at $85,838 on the Alpha Vantage daily closes used throughout this brief and at $85,801 on the feed behind Blockchain.News’ automated summary; a $37 difference on a band nearly nineteen thousand dollars wide is the ordinary consequence of different price sources and session boundaries, and it is listed rather than reconciled. Second, most of the attributed levels in this table were published on September 2–4, before or during Friday’s payrolls reversal, because Saturday produced almost no new analyst commentary — which is itself the accurate description of a weekend inside a US holiday break.
Momentum and volatility (charts 2 and 3)
Momentum kept leaking on a day price did not fall, which is the useful thing about Saturday’s momentum readings. The MACD line fell to 3,330.79 from 3,417.48 while the signal line eased only to 3,439.74 from 3,466.98, widening the histogram to −108.96 from −49.50 — a second session below signal, and roughly double the gap. This is the mechanical consequence of a fast average decaying toward a slow one after a peak: the twelve-day exponential average still carries the memory of Thursday’s $81,264 close and is shedding it faster than the twenty-six-day average is. The MACD line remains 3,331 above zero, so this is a loss of upward momentum rather than a change of trend direction. Of 631 earlier days in this series with the histogram negative and widening, the MACD line above zero and price above its 200-day average, the close was higher ten sessions later 55% of the time (median +0.8%) and twenty sessions later 53% (median +0.8%) — a coin flip with a slight upward tilt, which is the honest summary. RSI barely moved, to 66.80 from 66.49: a $156 up-day adds to both sides of the up/down ratio the formula compares, so a flat day produces a flat RSI. ADX rose an eighteenth consecutive session to 46.25 from 45.28, its highest since March 3, 2026, while the spread between the directional lines narrowed for a second day, from 27.28 to 26.69 points, as +DI fell from 36.85 to 36.04 and −DI from 9.56 to 9.35. Because ADX is a fourteen-period smoothing of that spread, the level is a lagging description of the past fortnight and can keep rising for several sessions after the spread has turned.
Volatility compressed on every measure for the first time in a week, and the Bollinger reading is again the most interesting. The 14-day ATR fell to $2,413 from $2,542 — the first decline in three sessions, and a $129 drop caused by a single $742 range that was only 0.29 times the prior day’s average. Thirty-day realized volatility eased to 46.42% from 46.59%, a shade below Friday’s reading, which was the highest since April 2, because a thirty-day window cannot be moved far by one quiet day. Bollinger band width contracted for a seventh straight day, to 24.53% from 28.97% and from the 40.03% peak of August 29; at 4.4 points this was the largest single-day contraction of the run, and the band narrowed from both sides once more, with the upper band falling $722 to $85,838 while the lower band rose $2,421 to $67,080. The mechanism is the same one described here yesterday: the twenty-day standard deviation is shrinking as the extreme days of mid-August roll out of the window, and it is shrinking faster than the twenty-day mean is rising. %B at 0.680, against 0.686, leaves price in the upper half of a band running $67,080 to $85,838 without pressing either edge. It is worth being careful about what a seven-day contraction is worth: of 420 earlier cases in this series of band width contracting seven days in a row from a level of 30% or more, price was higher twenty sessions later 49% of the time (median −0.5%) and ten sessions later 49% (median −0.4%). That is the closest thing to a pure coin flip on this board, and it is a useful corrective to the way squeezes are usually written about — compression describes dispersion narrowing, and carries no information about direction. Two other base rates attach to Saturday’s stillness and lean the other way: 832 earlier days with a range under 0.35 times the prior ATR and price above the 200-day average were higher ten sessions later 62% of the time (median +2.6%), and the 48 days with volume under 0.30 times its twenty-day average and price above the 200-day average were higher ten sessions later 62% of the time (median +1.7%). Both samples are dominated by the fact that this series trends more often than not, and neither is a signal.
Flows and positioning (chart 4)
Friday’s US spot Bitcoin ETF flow, which this brief reported twenty-four hours ago as not yet available, settled at a net inflow of $174.6 million on Farside’s tally — about a quarter of Thursday’s $730.8 million, and a return to the ordinary size of a session in this run. The per-fund table is unusual: BlackRock’s IBIT took $117.4 million, about 67% of the total, Fidelity’s FBTC took $57.2 million, and every other US spot Bitcoin ETF recorded no net flow at all. A day on which ten of twelve funds print zero is a thin, pre-holiday session rather than a broad reallocation. The more useful point for readers who follow this series is that the settled figure matched the first look this time, which breaks the run of four consecutive prints that had moved materially between the provisional number and the final one — the caution issued here yesterday still stands as a caution, but it did not bind on Friday. September’s four reported sessions now total about +$770 million against August’s completed +$3,524 million; Cointelegraph puts the latest week at +$986.9 million and the three-week run at $3.8 billion, which it describes as the strongest three-week stretch of 2026. The same report has Ether ETF inflows falling about 74% week-over-week, from $824.4 million to $218.4 million, and XRP ETF inflows about 83%, from $110.5 million to $19 million, with both still positive year-to-date at $863 million and $515 million respectively. There were no flows on Saturday and there will be none on Sunday or on Labor Day Monday, so the next print is Tuesday, September 8 — the same session on which the golden cross falls due on a mechanical projection.
The derivatives picture went as quiet as the spot market, and two of its three readings are too inconsistent to use. Liquidations are the clean one: CoinStats’ snapshot at 00:08 UTC put 24-hour crypto liquidations at $75.31 million, of which $67.45 million (89.6%) were long positions and $7.86 million short — a fall of about 90% from Friday’s roughly $757 million, and the smallest daily figure this brief has recorded. The long-heavy split on a day price rose slightly is worth a sentence: with volume at a quarter of normal, a small absolute amount of forced selling can move price more than usual, and the day’s $216 lower wick is the visible trace of it. On funding, the two available sources straddle zero. CoinStats gives −0.0007% per eight hours, which annualizes to about −0.77% on the ×3×365 convention used here — the site’s own page states −0.85%, which does not follow from the rate it quotes — against a seven-day average of +0.0051%; Blockchain.News’ automated summary gives +0.0010% per eight hours and calls it neutral. If CoinStats’ reading is right it is the first negative funding print this brief has seen — shorts paying longs rather than the reverse — but a weekend reading on a quarter of normal volume is a thin basis for calling a change in positioning, and the two sources disagree on the sign. On open interest, the level is reported above but no day-over-day change is claimed, because the available readings cannot be reconciled: the same tracker that reported about $57.68 billion yesterday reports about $54.90 billion today while simultaneously describing open interest as up 2.30% over two days, and Blockchain.News reports it up 6.58% in 24 hours. Those three statements cannot all be true, and this brief has now flagged this tracker’s internal inconsistency on three consecutive days. What can be said is that Bitcoin’s share of total crypto value was 59.0% and that total crypto market value was about $2.70 trillion.
On-chain and network
The difficulty retarget that this brief has tracked as a pending item for three consecutive days landed on Saturday, and it settles an argument. Difficulty rose about 1.30%, from 125.81T to 127,450,789,715,843 — 127.45T — at block 965,664, the end of the 2,016-block period, with the network now twelve blocks into the next one at height 965,676. The realised figure came in close to CoinWarz’s +1.35% estimate of Friday, which had itself been revised up from +0.86% two days earlier, and it is the reverse of the −1.31% adjustment of August 23. The mechanism is worth stating because it does the analytical work here: difficulty rises only when the preceding 2,016 blocks were found faster than the ten-minute target, which can only happen if aggregate mining capacity rose. That is direct, on-chain evidence about the question raised in this brief on Thursday and Friday, when CoinWarz’s live hashrate estimate of 867 EH/s was circulating alongside Cryptotimes’ seven-day smoothed average of about 914 EH/s and being read in some coverage as a decline. It was not a decline; a positive retarget is the network’s own measurement of the same quantity, taken over two weeks rather than a few hours, and it says capacity was stable to rising through late August. CoinWarz now estimates the next adjustment at +1.2% to 128.98T on September 19 at about 4:23 p.m. UTC, with average block time running at 9 minutes 53 seconds against the ten-minute target — seven seconds fast, which is why the next estimate is also positive.
The rest of the chain was quiet in the way weekends usually are. Decrypt reported that at least four more decade-old wallets moved a combined $15.7 million between August 29 and September 4, including one that turned an original $120 into about $3 million, with one batch of coins sent to Coinbase in what the report describes as a likely sign of a sale. Dormant-wallet awakenings are a recurring feature of rallies and a small number next to daily traded volume; they are worth noting as supply becoming available rather than as supply sold. On the corporate side there was no new activity to report: Strategy’s holdings stand at 845,050 BTC as of August 30, unchanged from yesterday’s brief, and the only Saturday item concerning the company was a Motley Fool commentary piece revisiting its earlier sales — 1,690 BTC for $108.6 million in the week ending August 9, and 3,328 BTC for $213 million across the two weeks to that date — against its subsequent purchase of 4,603 BTC for $369.7 million on August 31. No Glassnode, CryptoQuant or Axel Adler exchange-balance, MVRV or long-term-holder figure specifically dated to September 5 could be sourced when this brief was written, so none is quoted; the most recent readings remain the MVRV of 1.53 and the net 2,109 BTC exchange inflow of September 3 reported here yesterday.
Sentiment
The alternative.me Fear & Greed Index printed 74 (“Greed”) for September 5, up nine points from 65 on September 4 — the largest single-day move this brief has recorded in the index, on a day Bitcoin moved 0.2%. The explanation is the timing convention set out in earlier editions and confirmed again here: the value dated a given day is struck at the start of that UTC day, which is 8 p.m. New York on September 4 for the September 5 reading, half a day behind the price candle used throughout this brief, which closes at the end of the same UTC day. So the September 5 reading is a verdict on Friday’s US session — the payrolls sell-off to $78,626 and the recovery into the close — rather than on Saturday’s stillness. Two further points follow from the index’s construction. It blends volatility, momentum, market dominance and survey components rather than tracking price, and a sharp fall in volatility raises it mechanically, which is part of what happened here. And its direction over the past two days is the reverse of price on both: it rose two points on Friday’s 1.96% fall and nine points on Saturday’s flat session. At the time of writing the page showed 73 as the next day’s value, 68 a week earlier and 25 (“Extreme Fear”) a month ago. Of the eight Bitcoin-tagged articles in the Alpha Vantage news feed published between 00:00 UTC on September 5 and 04:00 UTC on September 6 — a thin weekend count against twenty on Friday — the feed’s sentiment model scored one as bullish, four as somewhat bullish, three as neutral, and none as bearish or somewhat bearish. The edge cases are again worth naming, because they cut against the model in both directions: a Motley Fool column headlined on Bill Gates calling crypto a “pure mania-driven asset” was scored somewhat bullish for Bitcoin, while a second Motley Fool column headlined “History Says That Bitcoin Is an Unbelievable Bargain Right Now” was scored neutral. A tally of this kind measures the tone of coverage as a machine reads it; on a weekend of eight articles, five of them from a single outlet, it is closer to noise than to a market indicator, and it is reported here for continuity rather than because it carries information.
Published views, in both directions, and thinner than on a weekday. On the constructive side, Bitfinex flagged what it described as a bullish weekly Super Trend signal — a trend-following indicator that flips state on a close beyond an average-true-range band — and Paul Howard, senior director at Wincent, described ETF inflows and returning retail liquidity as strengthening the price structure, projecting a “gradual trajectory toward $100,000 by end of 2026.” Richard Green, head of institutional at RootstockLabs, attributed the parallel rise in Bitcoin and gold to investors hedging against sovereign debt. Anthony Pompliano restated a long-term bullish thesis in coverage collected by CoinStats. On the cautious side, Fidelity urged caution and noted that broader cycle corrections may need more time to play out; Peter Schiff, a long-standing critic, argued that Bitcoin may be forming a top; and Adam Haeems, head of asset management at Tesseract Group, pointed to about $1.4 billion of Bitcoin put options outstanding while noting that call positioning “maintains upside exposure while curbing downside risk.” Options positioning was one of the few genuinely fresh data points of the weekend: near-term call demand is concentrated at the $80,000 strike with heavier positioning spread across $85,000–$95,000. One timing note: the Wincent, RootstockLabs and Tesseract comments were published on September 3–4 and the DWF Labs, Bitget Research, Glassnode and Bitfinex Alpha levels in the table above on September 4; Saturday itself produced almost no new analyst commentary, which is the ordinary state of a weekend inside a US holiday break.
Macro and cross-asset
There was no macro on Saturday, and that is the whole of the macro section this weekend. US stock and bond markets were closed, as they are every Saturday, and they will be closed again on Monday for Labor Day, which makes this a three-day break in the data flow and in the ETF creation-and-redemption machinery. Friday’s levels therefore stand as the most recent readings for every traditional asset: the S&P 500 closed at 7,718.60, down 0.38%; the Nasdaq Composite at 26,506.99, down 0.29%; the Dow at 53,414.26, down 0.51%; the 10-year Treasury yield at about 4.78% and the two-year at 4.374%; gold down about 1.3%; WTI crude near $91.40; and the dollar index at 99.17, up 0.17%. Those are Friday’s numbers, reported in yesterday’s edition, and they are repeated here as context rather than as a Saturday reading — nothing in the traditional-asset column changed, because nothing traded.
The policy backdrop is likewise Friday’s, one day older. CME FedWatch odds of a 25 basis-point rate increase at the September 15–16 FOMC stand near 60%, up from about 50% before the August employment report showed 162,000 jobs added against consensus near 55,000; the target range is 3.50%–3.75% and the committee meets under Chair Kevin Warsh, with the decision due Wednesday September 16 at 2 p.m. ET. August consumer prices on September 11 remain the reading that Joe Brusuelas of RSM named as the one that could stop a September hike. Inside crypto, the weekend tape belonged to the privacy coins rather than to Bitcoin: Zcash rose 16–20% and Dash by a larger margin on the Bitcoin News Digest’s summary, continuing a rotation that has been running for two weeks and that draws speculative capital away from Bitcoin at the margin. Bitcoin dominance was 59.0% on tv-hub.org’s whole-market measure dated September 5, against a total crypto market value of about $2.70 trillion; yesterday’s brief quoted CoinStats and CoinMarketCap at 59.7%, a different tracker with a different constituent list, so no day-over-day change in dominance is claimed here. One structural note from the same source, offered as context rather than as a reading: stablecoins worth more than $300 billion sit inside the denominator of the dominance calculation, which the site estimates suppresses the headline figure by six to eight percentage points relative to a measure of risk capital alone.
Calendar: what’s ahead
| Date (ET) | Event | Why Bitcoin traders watch it |
|---|---|---|
| Sun, Sep 6, 8 p.m. | Weekly candle closes (00:00 UTC Monday) | The 50-week average is computed here at $80,333, and Saturday’s close sits $502 below it; weekly closes around the 50-week average are the reference Rekt Capital has used (citing the exponential version, near $77,300 in August) to frame whether the move is more than a bear-market rally |
| Mon, Sep 7 | Labor Day — US stock and bond markets closed | No ETF creations or redemptions, no Treasury market, and thinner spot liquidity through the US session; Bitcoin itself trades normally |
| Tue, Sep 8 | US spot ETF flow reporting resumes (Friday’s was the last print); the golden cross falls due on a mechanical projection | Three days of accumulated brokerage-channel demand or supply arrive in one figure, on the same session the 50-day is projected to cross the 200-day |
| Tue, Sep 8, 6:00 a.m. | NFIB Small Business Optimism (August) | A minor reading, but the week’s first US data after the long weekend |
| Thu, Sep 10, 8:30 a.m. | August producer prices and weekly jobless claims | The first inflation reading since the payrolls print reopened the hike question |
| Thu, Sep 10, ~8:15 a.m. | European Central Bank rate decision and press conference | The euro side of the dollar index, which has tracked Bitcoin inversely through this run |
| Fri, Sep 11, 8:30 a.m. | August consumer price index | The reading Joe Brusuelas of RSM named as the one that could stop a September hike; it lands four days before the FOMC convenes |
| Tue, Sep 15, 2:15 p.m. | Senate cloture vote on the CLARITY Act | The market-structure bill needs 60 votes; Republicans hold 53 seats, so it requires cross-party support to proceed |
| Tue–Wed, Sep 15–16 | FOMC meeting; rate decision Wednesday 2 p.m. | Hike odds have moved between roughly 50% and 63% inside a week; the target range is 3.50%–3.75% |
| Fri, Sep 18 | September options expiry cited by DWF Labs | Martin Lee of DWF Labs puts max pain at $78,000 for this expiry; the notional size, and whether it is the monthly or a weekly, were still not reported when this brief was written |
| Sat, Sep 19, ~4:23 p.m. UTC | Next Bitcoin difficulty adjustment, estimated +1.2% to 128.98T | A second consecutive positive retarget would confirm that mining capacity is growing rather than leaving |
| Through September | Calendar-month seasonality | September has finished negative in nine of sixteen completed years in this series and is its weakest month by average return, at −3.3% — though the last three Septembers closed positive |
Reading the combination
Saturday is the quietest day of this rally, and the useful observation is that only price stopped moving. The trend layer advanced further on a flat day than it did on Friday’s 2% fall: the 50/200 gap closed by $257 to $593, a forty-seventh consecutive day of narrowing, and the crossing that has been three to four sessions away for two days is now two to three, with a mechanical projection landing on Tuesday September 8. The volatility layer compressed on every measure at once for the first time in a week — ATR down $129 to $2,413, band width down 4.4 points to 24.53% in the largest single-day contraction of its seven-day run, realized volatility flat. The momentum layer kept leaking without price falling: the MACD histogram roughly doubled its negative gap to −108.96, and the eighteenth consecutive ADX rise came with a second day of narrowing in the directional spread underneath it. The flow layer stayed positive but shrank to a quarter of Thursday’s size and then stopped entirely for the weekend. So the layers are not so much disagreeing as converging on a single description — compression — and that is exactly the reading with the weakest historical record on this board: 420 prior cases of seven-day band-width contraction from above 30% were higher twenty sessions later 49% of the time, median −0.5%, which is a coin flip pointing very slightly down. The readings that lean the other way are the ones attached to stillness rather than to the squeeze: 832 prior days with a range under 0.35 times the prior ATR and price above the 200-day average were higher ten sessions later 62% of the time (median +2.6%), the 48 days with volume this thin relative to their own average and price above the 200-day average were higher 62% of the time (median +1.7%), and 594 days with ADX at or above 46 and +DI above −DI were higher ten sessions later 66% of the time (median +4.4%). Set against those, September is the weakest month in this record, the golden cross that is arriving has been followed by a lower price thirty days later in half of its twelve prior instances, and eighteen of the fifty-four completed runs above the 200-day average reached this length, which is a filter rather than a forecast. Two things are worth holding separately from all of it. The first is that Saturday’s numbers were made on 2,148 BTC of volume — a quarter of normal, inside a three-day US holiday break — so the day is thin evidence about anything, and the same caution applies to the negative funding print and the collapse in liquidations. The second is that the calendar is empty until Tuesday: after Sunday evening’s weekly close against a 50-week average $502 above the market, there is no ETF print, no US data and no Treasury market until September 8, which is also the session on which the moving-average crossing is projected to land. The bracketing levels are narrow and specific: $80,201 to $80,333 immediately above, covering Saturday’s high and the 50-week average, with Glassnode’s $80,800 short-term-holder cost basis and $81,000–$86,000 supply zone beyond them; and $79,459 down to $78,000 below, covering Saturday’s low and the September 18 max-pain strike named by Martin Lee of DWF Labs. Which of those gives way first is not something these indicators can tell you.
Sources
Price, volume and all technical indicators: Alpha Vantage BTC/USD daily series (00:00 UTC candles), computed by the author; the September 5 candle was confirmed complete by the presence of a partial September 6 row. Fear & Greed: alternative.me. ETF flows: Farside Investors’ per-fund table and Cointelegraph on the three-week run and the Ether and XRP comparison. Derivatives, funding and open interest: CoinStats daily analysis (00:08 UTC snapshot) and Blockchain.News’ automated technical summary, which disagree on the sign of the funding rate and on the direction of open interest. Weekend narrative, options positioning and altcoin performance: Bitcoin News Digest for September 5. Network: CoinWarz difficulty for the completed retarget and the September 19 estimate. On-chain and corporate: Decrypt on the dormant wallets; Motley Fool on Strategy’s sales and holdings. Attributed levels and views: Crypto Times on Bitget Research, Glassnode, DWF Labs and Bitfinex Alpha; CoinGape on Ali Charts; Yahoo Finance on New Market Trading; Crypto Economy on Wincent, RootstockLabs and Tesseract Group. Golden-cross background: CoinDesk on the approaching cross and USDT dominance. Dominance and market value: tv-hub.org. Friday’s macro levels, repeated as context: TheStreet on the September 4 equity and bond close and FXStreet on the dollar index. Calendar: Kiplinger’s economic calendar and IG’s week ahead. News sentiment tally: Alpha Vantage NEWS_SENTIMENT feed for September 5.
Disclaimer. This post is published for general informational and educational purposes only. It is not investment, financial, trading, tax, or legal advice, and nothing in it should be read as a recommendation or solicitation to buy, sell, or hold Bitcoin or any other asset. Indicators describe past and present data; they do not predict future prices. Figures are drawn from third-party sources believed to be reliable but not guaranteed, and may be revised. The author holds no responsibility for any loss or decision arising from the use of this content. Cryptocurrency prices are highly volatile; anyone considering a trade should do their own research and consult a licensed financial professional.